

Solar Deployment: Utility-Scale Land-Based vs Rooftop Installations☀️🌲🌳🧑🌾🏢
A Critical Assessment of Market Potential, Economics, and the Farmland & Forest Land Controversy

Abstract
A growing narrative in energy and land-use discourse holds that solar photovoltaic (PV) development should be redirected away from agricultural and forested land and channeled onto the rooftops of warehouses, parking canopies, and similar built structures. This analysis subjects that argument to rigorous empirical scrutiny. Drawing on data from the National Renewable Energy Laboratory (NREL), Lawrence Berkeley National Laboratory (LBNL), the U.S. Department of Energy (DOE), the U.S. Department of Agriculture (USDA), Resources for the Future, and the Solar Energy Industries Association (SEIA), I compare the technical market potential, installed economics, levelized cost of energy (LCOE), and deployment practicalities of utility-scale ground-mounted solar versus built-environment alternatives. I find that: (1) the utility-scale land pipeline is structurally indispensable at 956 gigawatts of solar in the active interconnection queue (end-2024); (2) actual solar displacement of prime farmland is exceedingly small, well under 0.05 percent of total U.S. farmland acreage; (3) forest conversion to solar is a real and growing concern that is addressable through targeted siting policy rather than categorical restrictions on ground-mount solar; (4) commercial rooftop and solar canopy deployment carries a cost premium of 65–195 percent above utility-scale installations, making it economically complementary rather than substitutional; and (5) the binary framing of “built environment vs. farmland/forest” misrepresents the rich landscape of viable siting options, including brownfields, degraded lands, and marginal acreage. All pathways must be pursued in parallel.
1. Introduction
The energy transition is fundamentally a land-use transition. Replacing the concentrated energy density of fossil fuels with diffuse renewable resources requires physical space at a scale that inevitably intersects with existing land uses — agriculture, forestry, habitat, and developed areas alike. As solar photovoltaic deployment has accelerated in the United States, a vocal and increasingly mainstream argument has emerged: that utility-scale ground-mounted solar development on rural land is wasteful and unnecessary, because sufficient capacity could instead be harvested from the rooftops of warehouses, parking structures, shopping centers, and other built environments.
This argument has intuitive appeal. The United States has an enormous commercial and industrial building stock. Its parking lots are vast. The instinct to “first use what has already been disturbed” before consuming green or productive land reflects sound conservation logic. But the argument as typically advanced suffers from three interrelated analytical failures: it conflates technical potential with economically deployable capacity; it overstates the magnitude of solar’s actual land footprint relative to total agricultural and forested area; and it ignores the structural cost economics that make utility-scale deployment indispensable to achieving decarbonization at the required pace.
This analysis offers a comprehensive, data-grounded assessment organized as follows. Section 2 establishes the scale of the solar deployment challenge through 2035 and 2050. Section 3 analyzes utility-scale ground-mounted solar — its economics, land requirements, and pipeline. Section 4 examines commercial and industrial rooftop solar and solar carports. Section 5 addresses the agricultural land controversy with empirical rigor. Section 6 examines the separate but critical issue of solar development on forested land. Section 7 provides a direct comparative synthesis with supporting data tables. And Section 8 draws policy implications.
2. The Scale of the Deployment Challenge
To appreciate why no single siting strategy can suffice, one must first understand the magnitude of solar capacity the United States must deploy. The DOE’s Solar Futures Study (2021) projects that solar must supply approximately 45 percent of U.S. electricity by 2050 to achieve full grid decarbonization — up from roughly 4 percent when that study was published in 2021, and approximately 7 percent as of full-year 2024 (EIA Electric Power Monthly, 2025). Meeting the 2050 target requires sustaining and further accelerating recent installation rates: utility-scale solar additions reached a record 30.8 GWₙᶜ in 2024 and 27.2 GWₙᶜ in 2025 (EIA, 2026), with 43.4 GWₙᶜ planned for 2026. Reaching 45 percent solar by 2050 will require pushing annual additions well above current levels and holding them there through mid-century.
As of the end of 2024, LBNL’s 2025 Data Update documented a cumulative installed utility-scale solar photovoltaic (PV) capacity of approximately 110 GWₙᶜ across all 50 states, with a record 30 GWₙᶜ of new utility-scale capacity added in 2024 alone — nearly double the 18.5 GWₙᶜ added in 2023, which was itself the prior record. On a DC basis, total solar capacity across all segments (utility-scale, commercial, and residential) reached 236 GWᴰᶜ at year-end 2024 (SEIA, 2025). Wind and solar combined accounted for approximately 83 percent of all new U.S. generating capacity added in 2024 (NREL, 2025). By end-2024, solar had become the second-largest source of U.S. generating capacity by nameplate rating, surpassing wind (NREL Spring 2025 Solar Industry Update). The solar interconnection queue — the pipeline of projects seeking grid connection — contained 956 GW of solar capacity at the end of 2024, down 12 percent from the 2023 peak of 1,086 GW due to project withdrawals and emerging queue reforms (LBNL Queued Up: 2025 Edition). The DOE estimates that achieving 45 percent solar by 2050 will require approximately 10 million acres of land for solar installations (DOE Solar Futures Study, 2021). At that scale, the question is not whether ground-mounted solar will be needed, but how wisely it can be sited.
3. Utility-Scale Ground-Mounted Solar
3.1 Market Scale and Pipeline
Utility-scale solar — conventionally defined as installations above 5 MWₙᶜ — is the overwhelmingly dominant segment of U.S. solar deployment by capacity. LBNL’s Utility-Scale Solar 2025 Data Update records approximately 110 GWₙᶜ of operating utility-scale PV at year-end 2024 — up from 80.2 GWₙᶜ at end-2023 — with a record 30 GWₙᶜ added in 2024 alone, representing 61 percent of all utility-scale capacity additions that year (EIA, 2025). On a DC basis, the utility-scale segment alone installed 41.4 GWᴰᶜ in 2024, a 33 percent year-over-year increase (SEIA, 2025). The solar interconnection queue stood at 956 GW at end-2024 — a 12 percent decrease from the 2023 peak of 1,086 GW largely due to project withdrawals and queue reforms — per LBNL’s Queued Up: 2025 Edition. Historically, approximately 13 percent of capacity that entered interconnection queues from 2000–2019 reached commercial operations by end-2024; 77 percent was withdrawn.
3.2 Land Requirements
NREL’s most comprehensive empirical study of utility-scale land requirements (Ong et al., 2013) established a capacity-weighted average of approximately 8.9 acres per MWₙᶜ for total site area. A more recent LBNL analysis (2022) using 736 plants (35.5 GWᴰᶜ) found median power densities of 0.35 MWᴰᶜ/acre for fixed-tilt and 0.24 MWᴰᶜ/acre for single-axis tracking systems. SEIA’s planning figure of 5 to 7 acres per MWₙᶜ is commonly cited and includes access roads, substations, setbacks, and buffer areas.
A critical distinction often absent from land-use discussions is between total site area and direct-impact area. In a typical utility-scale installation, the direct-impact area — land physically occupied by panels, roads, and infrastructure — is considerably smaller than the fenced perimeter. Vegetation beneath and between rows often persists, and agrivoltaic configurations (discussed in Section 5) further reduce the effective land-use conflict.
3.3 Economics and Cost
NREL’s 2024 Annual Technology Baseline (ATB) records an overnight capital cost of $1.56/Wₙᶜ for a 100 MWᴰᶜ single-axis tracking system in 2023, while LBNL’s empirical sample of completed 2023 projects yielded a capacity-weighted average of $1.43/Wₙᶜ — a 75 percent reduction from 2010, averaging approximately 10 percent per year (LBNL Utility-Scale Solar, 2024 Edition). Preliminary 2024 cost data in the LBNL 2025 Data Update suggest installed costs continued to decline, though tariff uncertainty and supply-chain pressures introduced upward volatility that will be more fully quantified in the forthcoming LBNL 2025 full edition. Fixed-tilt utility-scale systems benchmark as low as $0.94/Wᴰᶜ. These economics translate to LCOEs of $29 to $46 per MWh depending on solar resource, making utility-scale PV among the cheapest electricity sources ever built.
The scale advantages producing these economics — bulk module procurement, standardized mechanical and electrical designs, single grid connection points, optimized logistics, and single-axis tracking — are not replicable at the system sizes imposed by individual rooftops or parking canopies. This is not a temporary technology gap; it is a structural feature of the economics of distributed versus centralized generation.
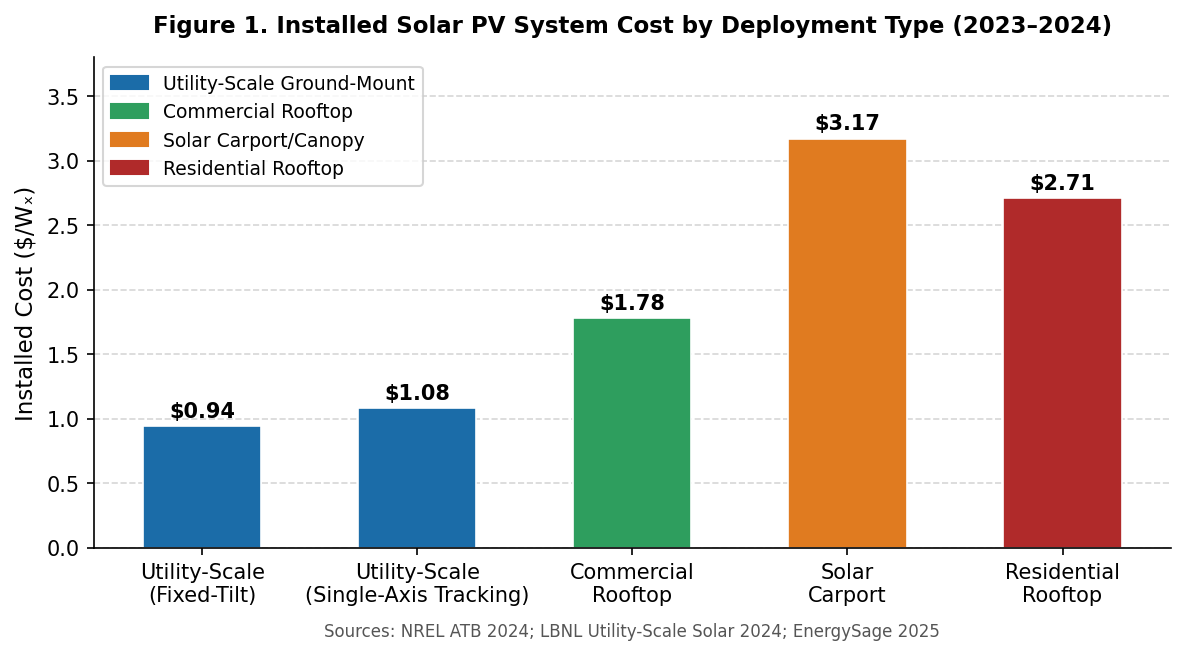
Figure 1. Installed capital cost comparison by solar deployment type (2023–2024). The 65–195% cost premium of built-environment alternatives over utility-scale ground-mount reflects irreducible structural and logistical overhead.
4. Commercial Rooftop Solar and Solar Carports
4.1 Technical Potential of Commercial and Industrial Rooftops
NREL’s landmark 2016 assessment used LiDAR data from 128 U.S. cities to determine that suitable rooftops across all building types could accommodate 1,118 GW of installed capacity, generating approximately 1,432 TWh per year — 39 percent of national electricity sales at that time (Gagnon et al., 2016). Of that total, 731 GW (65 percent) came from small buildings (residential and small commercial, under 5,000 sq ft), which have lower per-unit utilization rates due to roof variability. Medium and large commercial buildings — the warehouse, distribution center, retail, and manufacturing stock — contribute approximately 386 GW and 506 TWh/year.
Industry estimates suggest there are more than 5 billion square feet of warehouse rooftop space in the U.S. Sol-Ark (2025) cites expert projections that warehouse rooftops alone could generate up to 185.6 TWh/year — roughly 4 percent of current national electricity consumption. Despite this potential, Earth Finance (2022) found that only approximately 3.5 percent of commercial and industrial buildings had rooftop solar, implying a residual untapped potential on the order of 145 GW from commercial stock.
4.2 Practical Barriers to Commercial Rooftop Deployment
The gap between technical potential and achievable deployment is substantial. Key constraints include:
The gap between technical potential and achievable deployment is substantial. Key constraints include:
Roof structural condition and load capacity: Many older commercial roofs cannot support the added load of a solar array (3–4 lbs/sq ft) without engineering assessment and, often, structural reinforcement or full roof replacement.
Split-incentive problem: In tenant-occupied buildings, the owner bears installation cost while the tenant captures savings. Power purchase agreements and green lease structures are beginning to address this, but slowly.
Roof replacement timing: Solar installations carry 25–30 year warranties. Installing on a roof due for replacement in under a decade creates stranded-asset risk and often necessitates early removal and reinstallation.
Orientation and shading constraints: Unlike ground-mount systems, rooftop arrays are fixed to existing roof geometry. North-facing sections, shading from HVAC equipment and parapet walls, and suboptimal tilt angles reduce capacity factors materially compared to optimally sited ground-mount systems.
Interconnection overhead: A 500 kW rooftop system and a 500 MW utility-scale plant may face similar interconnection application queues and administrative burdens on a per-project basis, dramatically skewing the cost per megawatt for smaller installations.
4.3 Solar Carports: Promise and Economic Reality
Solar carports are among the most intuitively appealing alternatives to land-based solar, and for good reason: U.S. parking lots cover an estimated 6,000+ square miles of impervious, ecologically dead surface. As of 2024, however, only approximately 4.7 GW of solar carport capacity had been installed in the United States (Industry Research, 2026) — reflecting substantial economic headwinds.
EnergySage (2025) pegs commercial solar carport costs at approximately $3.17/W, roughly three times the utility-scale benchmark. The premium arises from genuine structural requirements: custom-engineered canopy frameworks, concrete footings per post, clearance for vehicle height (8–14 feet), wind and snow load engineering, and complex electrical routing through a vehicle-traffic environment. The Lockheed Martin SLRC solar carport (Orlando, FL) is a well-documented example: 2 MW on 4 acres, $6 million total capital, or $3.00/W — constrained by utility interconnection limits at a single meter.
The solar carport market is growing, with a projected CAGR of approximately 7.9 percent through 2032, driven in part by electric vehicle (EV) charging infrastructure integration. But 4.7 GW of installed capacity after decades of advocacy for the concept is a realistic measure of the barriers. While carports are a valuable distributed resource and offer dual-use benefits (shade, EV charging, covered parking), they will not materially substitute for utility-scale development at the terawatt scale required by mid-century targets.
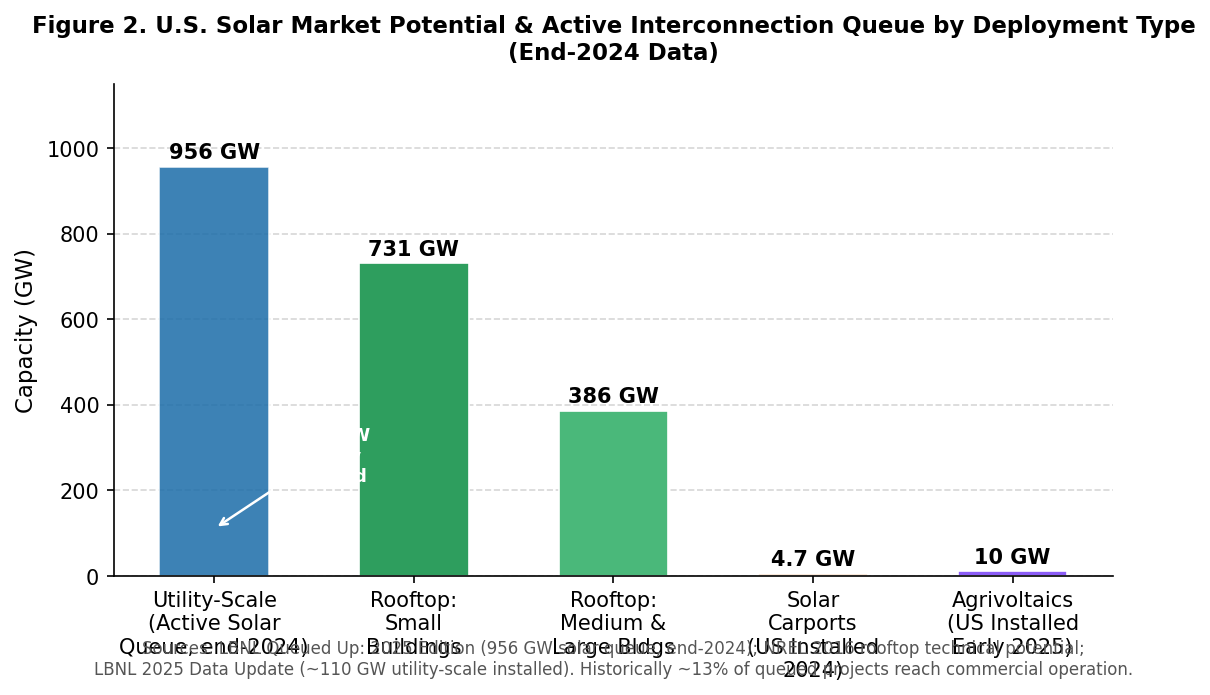
Figure 2. U.S. solar active interconnection queue and installed capacity by deployment type (end-2024). The utility-scale queue of 956 GW dwarfs all built-environment categories combined; ~110 GW is already operating. Note: approximately 13% of queued projects from 2000–2019 reached commercial operation by end-2024 (LBNL Queued Up: 2025 Edition).
4.4 Geographic Economics: Where Commercial Rooftop Solar Is Competitive Today
A critical and often overlooked dimension of the commercial rooftop solar debate is geographic price differentiation. The national average commercial electricity rate of 12.75 cents per kilowatt-hour (kWh) in 2024 (EIA, 2024) masks an extraordinary range — from 7.19 cents in North Dakota to 38.18 cents in Hawaii. Because commercial rooftop solar is primarily a behind-the-meter resource that displaces retail electricity purchases, the relevant comparison is not its levelized cost of energy (LCOE) versus the wholesale market, but its all-in cost versus the retail rate the host business would otherwise pay. This section applies that framework to the EIA’s 2024 state-level commercial electricity rate data to identify where rooftop solar is economically competitive today, and to estimate the capacity and energy generation potential residing in those markets.
The economic break-even analysis proceeds as follows. NREL’s 2024 benchmark commercial rooftop system cost of $1.78/Wᴰᶜ, after application of the 30 percent Investment Tax Credit (ITC) and the Modified Accelerated Cost Recovery System (MACRS) five-year bonus depreciation (which together reduce effective net cost by approximately 38 to 40 percent for tax-paying entities), yields an effective capital cost of approximately $1.07 to $1.10/Wᴰᶜ. Amortized over 25 years at an 8 percent discount rate and combined with NREL’s fixed operations and maintenance (O&M) benchmark of approximately $17/kWᴰᶜ per year, the resulting all-in levelized cost of electricity (LCOE) ranges from approximately 7.5 to 9.0 cents/kWh in high-insolation states (annual yield ≥1,500 kWh/kWᴰᶜ), to approximately 9.5 to 11.0 cents/kWh in average-resource states, to approximately 12.0 to 13.5 cents/kWh in less sunny northeastern and Pacific Northwest states. For building owners who cannot efficiently monetize ITC and MACRS directly — due to split-incentive structures, insufficient tax appetite, or ownership complexity — a third-party power purchase agreement (PPA) or property assessed clean energy (C-PACE) structure adds a developer margin of approximately 15 to 25 percent, shifting effective costs to approximately 9 to 17 cents/kWh depending on location.
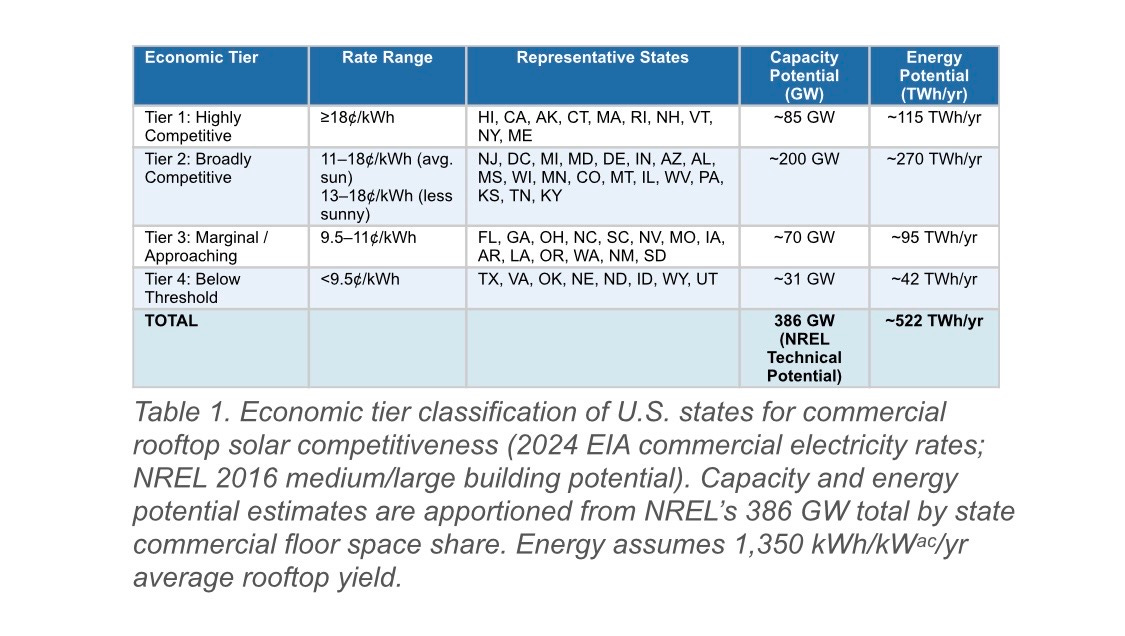
Applying these thresholds against the 2024 EIA commercial rate data yields a four-tier geographic classification:
Tier 1: Highly Competitive (commercial rate ≥18 cents/kWh). These ten states and jurisdictions — Hawaii (38.18¢), California (25.54¢), Alaska (21.57¢), Connecticut (21.21¢), Rhode Island (21.09¢), Massachusetts (20.90¢), New Hampshire (19.40¢), Vermont (18.89¢), New York (18.77¢), and Maine (18.22¢) — have commercial rates so far above any plausible post-incentive rooftop LCOE that commercial solar is economically compelling even without ITC, even in third-party PPA structures, and even on less-than-ideal rooftops with suboptimal orientation. California is by far the dominant market in this tier: its 25.54¢/kWh commercial rate, combined with the nation’s largest commercial building stock and excellent solar irradiance, makes it the pre-eminent commercial rooftop solar market. The state already accounts for a large plurality of U.S. commercial solar installations.
Tier 2: Broadly Competitive (commercial rate approximately 11 to 18 cents/kWh in average-sun states, or 13 to 18 cents in less sunny states). This large tier includes DC (17.07¢), New Jersey (14.64¢), Alabama (13.64¢), Michigan (14.01¢), Maryland (12.96¢), Wisconsin (12.63¢), Indiana (12.44¢), Delaware (12.20¢), Arizona (12.23¢), Mississippi (12.32¢), Minnesota (12.15¢), Tennessee (12.05¢), Montana (11.87¢), Illinois (11.81¢), Colorado (11.71¢), West Virginia (11.62¢), Kentucky (11.50¢), Kansas (11.19¢), and Pennsylvania (11.03¢), among others. In this tier, ITC and MACRS access is important to competitiveness, and high-quality south- or west-facing rooftops with minimal shading are required in the lower-rate states. Importantly, Arizona, Colorado, and states of the Southeast (Alabama, Mississippi) combine moderate commercial rates with high solar irradiance, producing some of the best actual economics in this tier.
Tier 3: Marginal / Approaching Threshold (approximately 9.5 to 11 cents/kWh). This group — including Florida (10.99¢), Georgia (10.87¢), North Carolina (10.56¢), South Carolina (10.64¢), Ohio (10.66¢), Nevada (10.19¢), Missouri (10.26¢), Iowa (10.22¢), Arkansas (10.24¢), Louisiana (10.46¢), Oregon (10.11¢), Washington (9.99¢), New Mexico (10.54¢), and South Dakota (10.55¢) — sits at or just above the break-even threshold for well-sited, incentive-supported commercial rooftop systems in sunny regions. Florida’s position here deserves special note: despite a 10.99¢/kWh average commercial rate that appears marginal by this analysis, the state’s exceptional solar resource (1,600 to 1,700 kWh/kWᴰᶜ per year) pushes effective post-incentive LCOE low enough that well-structured projects pencil out in most cases.
Tier 4: Below Economic Threshold (below 9.5 cents/kWh). Texas (8.55¢), Virginia (8.72¢), Oklahoma (8.92¢), Nebraska (8.39¢), North Dakota (7.19¢), Idaho (9.17¢), Wyoming (9.27¢), and Utah (9.39¢) have commercial electricity rates low enough that commercial rooftop solar is difficult to justify economically without additional state incentives or above-average solar resources. Texas merits individual attention: while its statewide average commercial rate is only 8.55¢/kWh, the deregulated ERCOT market produces substantial spatial and temporal price variation — some commercial customers in peak-demand zones face effective marginal costs well above that average, and commercial solar paired with demand-charge management can still be economic for some customer classes.
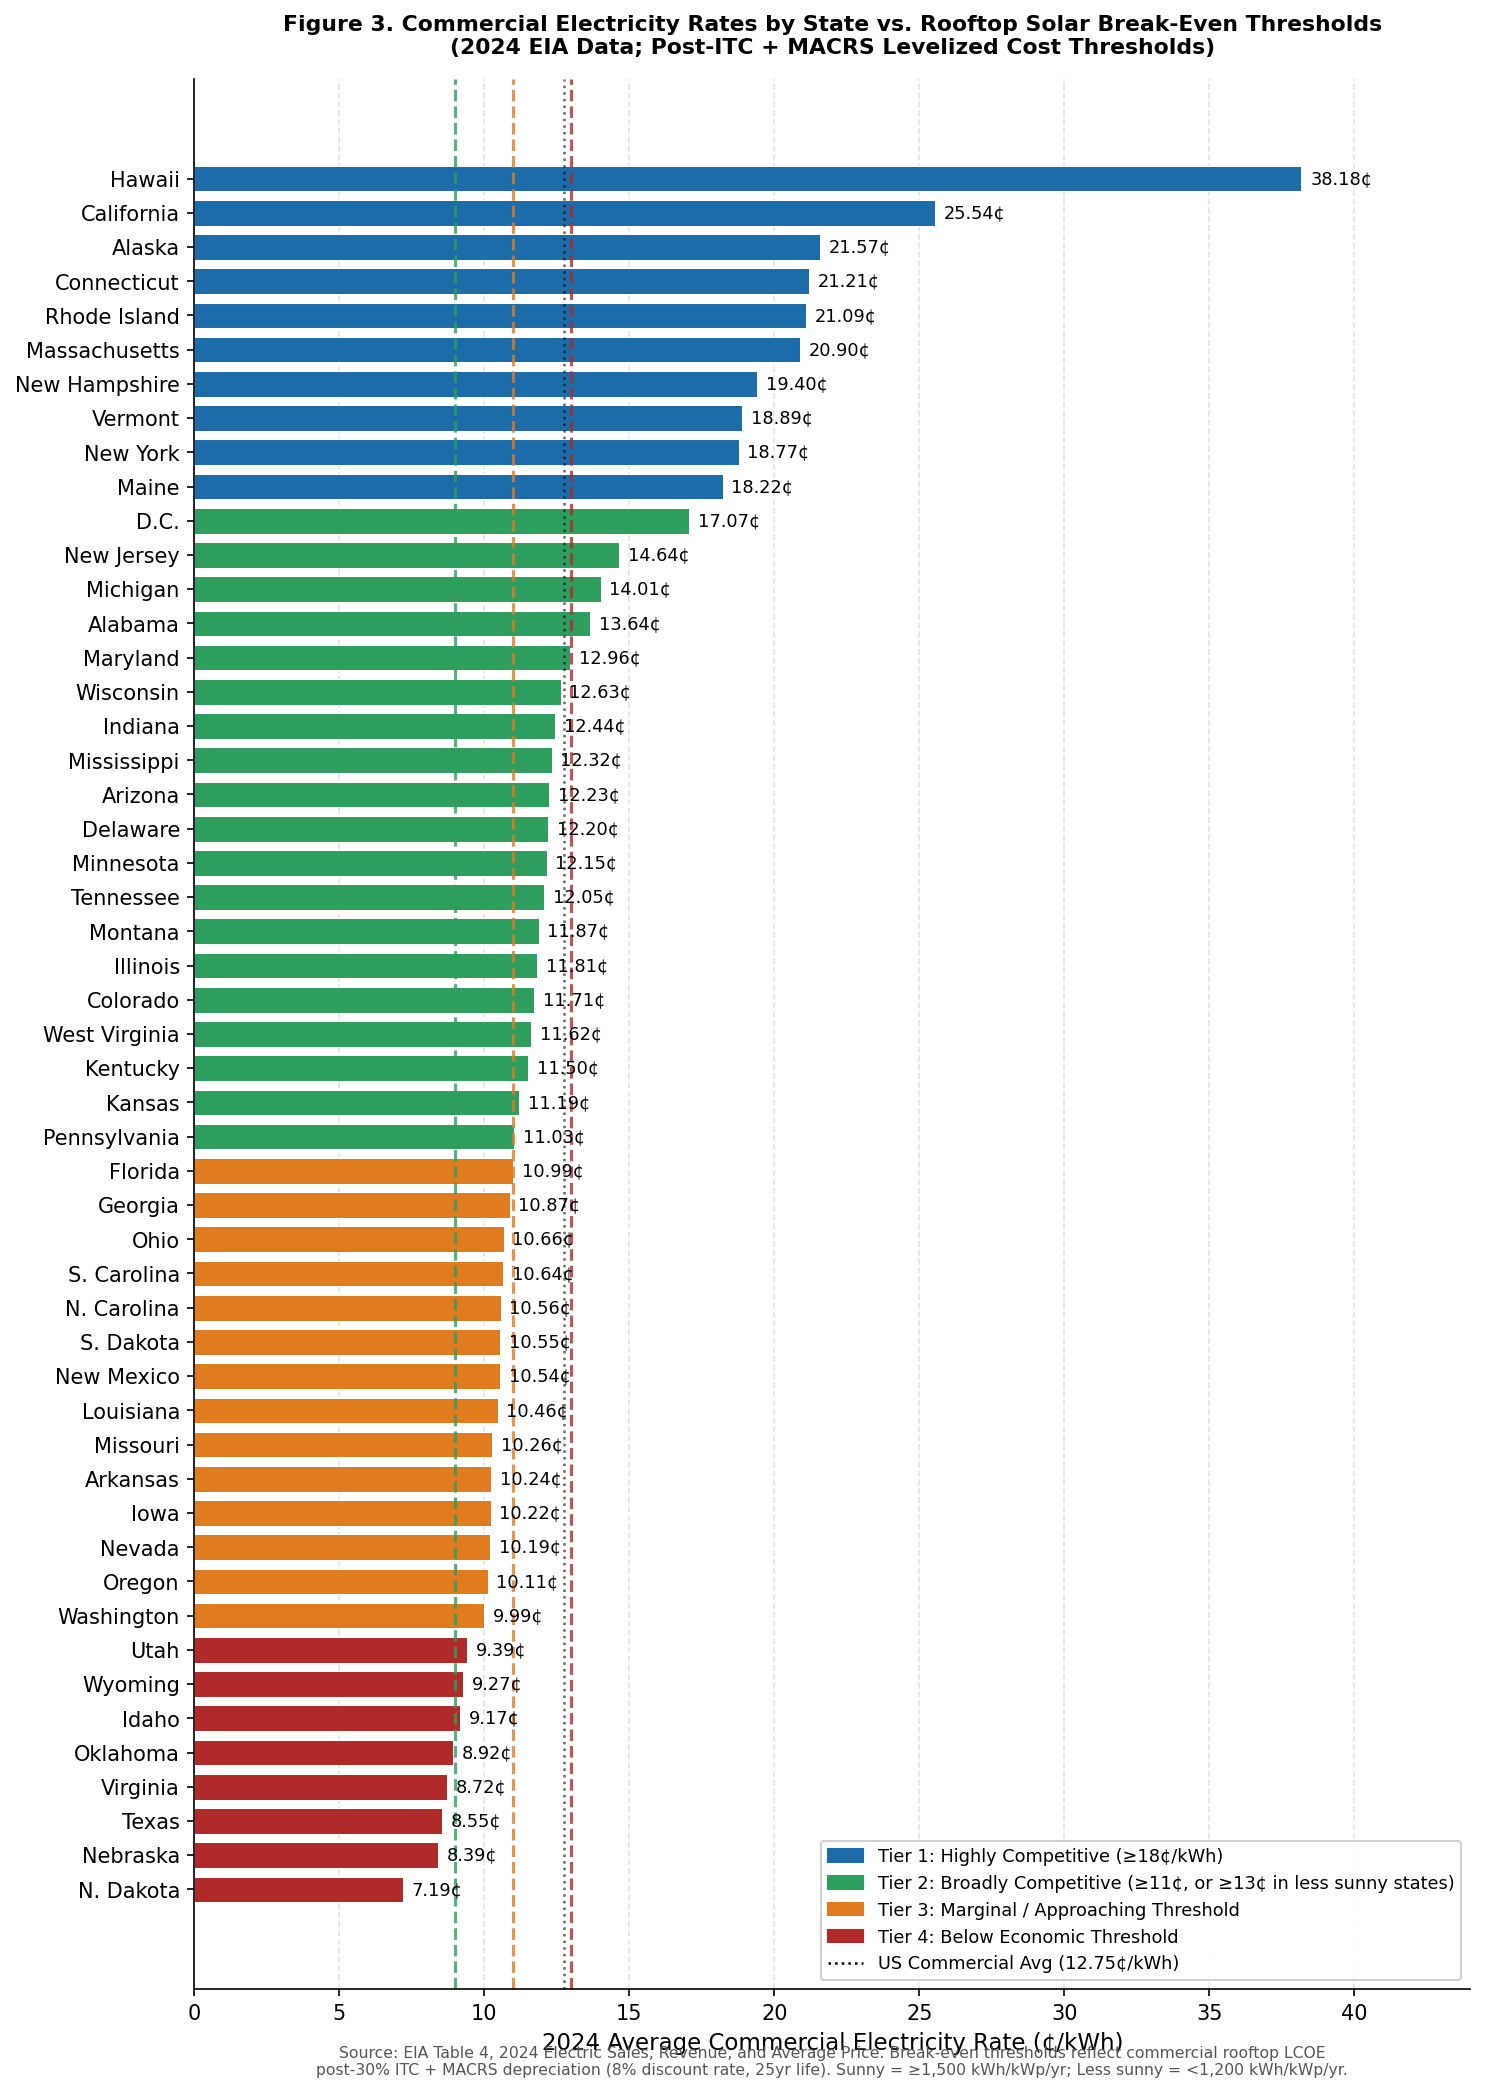
Figure 3. 2024 EIA average commercial electricity rates by state versus post-ITC + MACRS rooftop solar break-even thresholds. States above 18¢/kWh (Tier 1, blue) are highly competitive regardless of incentive access. States 11–18¢/kWh (Tier 2, green) are broadly competitive with standard ITC/MACRS incentives. Source: EIA Table 4, 2024.
4.5 Geographic Capacity and Energy Potential in Economically Competitive Markets
Translating the rate-tier framework into capacity and energy potential requires apportioning NREL’s estimated 386 GW of medium and large building rooftop potential across states. No authoritative state-level disaggregation of the NREL (2016) estimate exists, but a reasonable approximation can be constructed by weighting each state’s share of the 386 GW total by its share of total U.S. commercial floor space — using data from the EIA Commercial Buildings Energy Consumption Survey (CBECS) and state GDP as proxies.
Under this apportionment, Tier 1 states — dominated by California, New York, Massachusetts, and Connecticut — account for approximately 22 percent of U.S. commercial building stock, or roughly 85 GW of the 386 GW technical potential. At an average rooftop yield of approximately 1,350 kWh per kWᴰᶜ per year (blended for the solar resources of these states), this translates to approximately 115 TWh of annual electricity generation. Tier 2 states contribute an additional estimated 200 GW and approximately 270 TWh/year. Together, Tiers 1 and 2 represent approximately 285 GW of rooftop potential — nearly three-quarters of the total NREL estimate — in markets where commercial rooftop solar is broadly competitive with standard ITC and MACRS incentives.
To put these figures in national context: 285 GW of commercial rooftop solar, if fully built out, would generate approximately 385 TWh per year — roughly 8.3 percent of current U.S. electricity consumption (4,650 TWh in 2024) and enough to power approximately 35 million average American homes. This is a genuinely large and meaningful number, further validating the case for aggressive commercial rooftop deployment. However, it remains far short of the approximately 8,500 to 10,000 TWh of additional generation needed to reach the DOE’s 45 percent solar target by 2050 — again confirming that commercial rooftop solar is a valuable but not sufficient complement to utility-scale ground-mount.
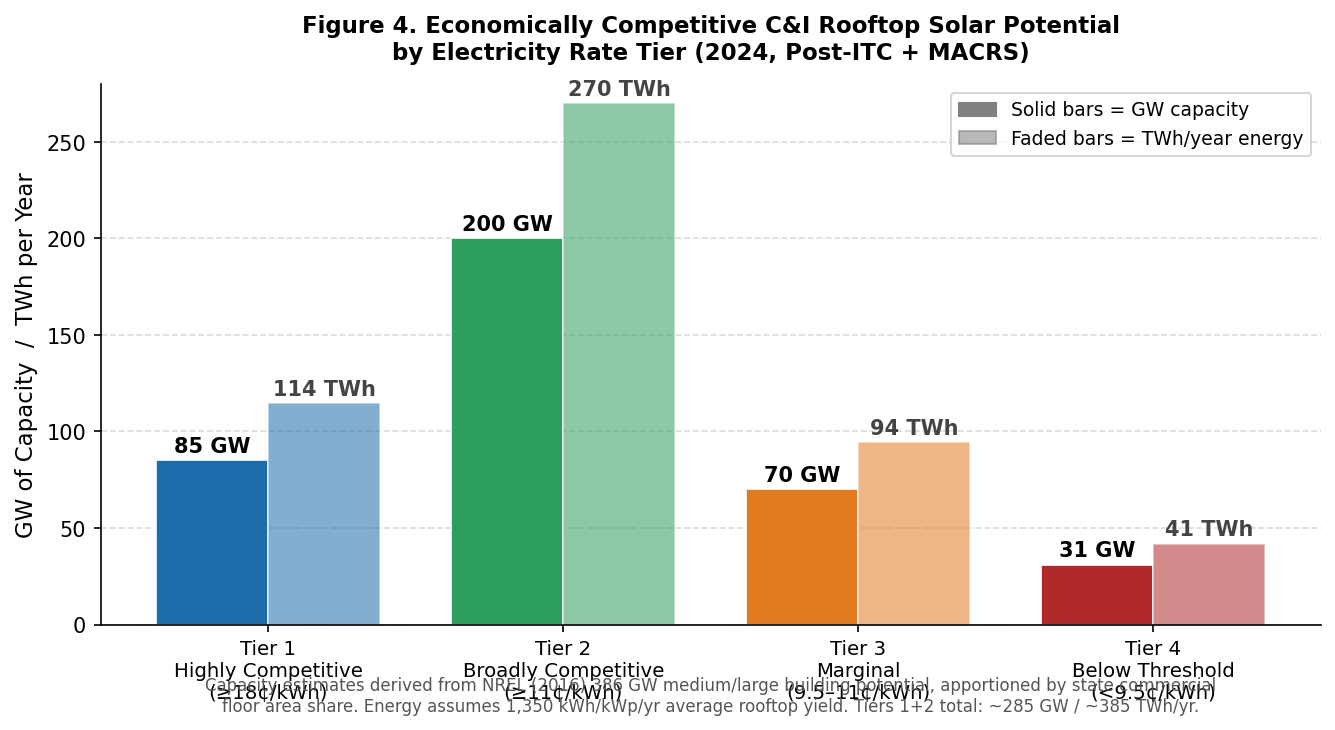
Figure 4. Estimated U.S. medium/large commercial rooftop solar capacity and energy potential by economic tier (2024 EIA commercial rate data; NREL 2016 technical potential apportioned by state commercial floor space share). Tiers 1+2 combined: ~285 GW / ~385 TWh/yr.
5. The Agricultural Land Controversy: Evidence Versus Narrative
5.1 Actual Scale of Solar on Farmland
The USDA Economic Research Service (ERS) published the most authoritative empirical assessment of solar’s agricultural land footprint in 2024. Examining land cover in the three years before and after the installation of solar farms in rural areas, USDA ERS found that from 2012 to 2020, approximately 70 percent of solar farms in rural areas were installed on agricultural land (cropland or pasture-rangeland). However, the total rural land directly affected by solar in 2020 was just 424,000 acres — compared to 897 million total acres of U.S. farmland. That is 0.047 percent — less than one-twentieth of one percent of the national farmland base.
Equally important: USDA ERS found that cropland or pasture-rangeland usually stayed in the same land-use category even after the addition of solar development in nearby areas. The feared large-scale conversion of productive agricultural land to permanent solar use is not, as of the most recent data, occurring at a significant scale.
5.2 The Agrivoltaics Option
Agrivoltaics — the co-location of solar energy production with agricultural activities beneath or between panels — represents a structural solution to the farmland-solar conflict. As of early 2025, NREL had identified 596 agrivoltaic sites in the United States covering approximately 65,699 acres and producing over 10,473 MW, enough to power approximately 7.5 million homes. The predominant configuration combines solar with pollinator habitat or livestock grazing, though vegetable, berry, and specialty crop production under elevated panels is a growing application.
The DOE estimates that agricultural land in the United States has the technical potential to provide 27 terawatts of solar capacity — a quarter of the estimated total U.S. solar potential of 115 TW. Critically, only 0.3 percent of farmland is expected to be used for solar by 2035, even under aggressive deployment scenarios (DOE, SETO). The economic incentive is notable: Purdue University’s Ag Economy Barometer found that 58 percent of farmers reported being offered annual payments of $1,000 or more per acre to lease their land for solar — compared to an average cash rent of $153 per acre for cropland in many states.
5.3 Prime Farmland and Siting Policy
The more legitimate concern is not the aggregate acreage consumed, but whether the specific acreage lost includes irreplaceable prime farmland — soils with the highest agricultural productivity. A 2024 Virginia Tech/Virginia Department of Energy study found that acres of solar-disturbed land designated as prime farmland accounted for just 0.25 percent of all prime farmland in Virginia, one of the nation’s leading solar states. The American Farmland Trust estimates that up to 80 percent of the 10 million acres needed for solar by 2050 could end up on agricultural lands — a legitimate concern that points toward the need for siting policy, not a categorical prohibition on ground-mount solar.
Targeted regulatory approaches — local and state ordinances that prioritize brownfields, degraded agricultural land, highway rights-of-way, and truly marginal soils; that require agricultural compatibility assessments for prime farmland conversions; and that incentivize agrivoltaic configurations — can address the real concern (protecting the most productive soils) without foreclosing the utility-scale pathway that economics and scale require. More than 400 U.S. counties have either banned solar development or made it very difficult (Weise et al., 2024), suggesting that local governance is already a significant brake on land-use impacts.
6. The Forest Land Issue: A Distinct and Growing Concern
6.1 The Extent of Forest Conversion to Solar
The conversion of forested land to solar installations is a distinct issue from agricultural land use, with different ecological stakes and a somewhat different policy landscape. Resources for the Future (RFF, 2025) published the most current and rigorous analysis of this question, finding that solar facilities — which occupied approximately 0.3 million acres in 2021 — could occupy 3 million to 7.5 million acres by 2035 and 5 million to 12 million acres by 2050 under various decarbonization scenarios. From 2012 to 2020, more than 90 percent of large-scale wind turbines and 70 percent of solar farms in rural areas were installed on agricultural land — meaning forests were not the dominant target. However, the RFF analysis identifies an important and growing pattern of forest-to-solar conversion that warrants serious attention.
The scale varies sharply by state. In some southeastern and mid-Atlantic states, forest-to-solar conversion is occurring at meaningful rates, driven by the combination of available land, good solar resource, proximity to transmission, and relatively lower land prices compared to productive cropland. Several states have begun responding with legislative and regulatory interventions: Rhode Island established its Renewable Ready program with provisions to prevent loss of forestland to solar farms, and Connecticut passed comprehensive energy legislation in 2024 that, while not explicitly addressing forest conversion, incorporated environmental justice considerations relevant to siting. Illinois passed legislation in 2023 limiting solar siting by local jurisdictions, a different approach that prioritizes deployment speed over specific land-cover protections.
6.2 Why Forest Loss Is a More Serious Ecological Concern Than Agricultural Conversion
The ecological stakes of forest-to-solar conversion are substantially higher than for agricultural land conversion, for several reasons. Agricultural land — particularly row-crop monocultures — already has severely diminished ecological function. Its conversion to solar, especially with native understory vegetation under panels, can in some cases represent an ecological improvement in terms of soil health, water infiltration, and pollinator habitat. Forests, by contrast, provide ecosystem services — carbon sequestration, watershed protection, biodiversity habitat, regional climate regulation — that cannot be replicated by solar installations and are not restored on any relevant human timescale if lost.
A solar array clearing a working pine plantation is ecologically and economically very different from one clearing an old-growth hardwood forest, and both differ from clearing degraded scrubland that has not supported meaningful forest function for decades. RFF (2025) notes that predicting future forest conversion requires state-level analysis linking solar capacity projections to observed conversion rates, precisely because the ecological stakes are so site-specific. This argues for granular siting policy rather than categorical rules.
6.3 Low-Impact Alternatives and Proper Siting Hierarchy
A sound siting hierarchy for utility-scale solar should prioritize, in descending order of preference:
Previously disturbed or developed land: brownfields, former industrial sites, closed landfills, contaminated land (so-called “brightfields”), and retired fossil fuel plant sites.
Degraded agricultural land: marginal cropland with low productivity ratings, land in Conservation Reserve Program (CRP) enrollment, highly erodible soils, and fallow land with no near-term agricultural use.
Active agricultural land with agrivoltaic compatibility: pasture and rangeland suited to sheep or cattle grazing under panels; specialty crops such as berries and leafy greens that tolerate or benefit from partial shading.
Low-productivity or managed forest land: tree plantations, recently logged areas, and scrubland with minimal standing ecological value — with careful habitat assessment.
High-productivity prime cropland, wetlands, and ecologically significant forest: avoided wherever feasible, subject to rigorous mitigation requirements when unavoidable.
The built-environment pathway — rooftops and carports — slots naturally into this hierarchy as a complement to, not a substitute for, well-sited ground-mount. It does not solve the forest or farmland problem, because its scale is too limited; but it draws down net demand for rural land at the margin.
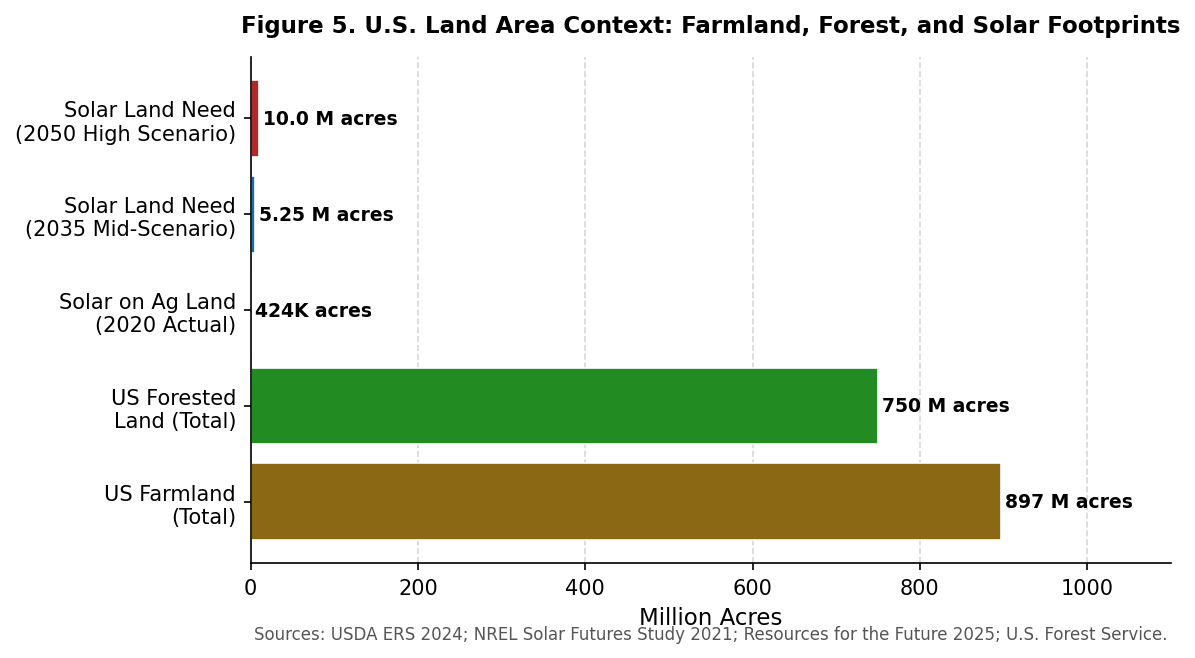
Figure 5. U.S. land area context: total farmland, total forested land, and solar land footprints (actual 2020 and projected 2035/2050). Solar’s actual footprint is minuscule relative to both farmland and forest baselines, but trajectory and siting quality matter enormously.
7. Comparative Synthesis
The following table places the key metrics of each solar deployment type in direct comparison, using the most current authoritative data available.
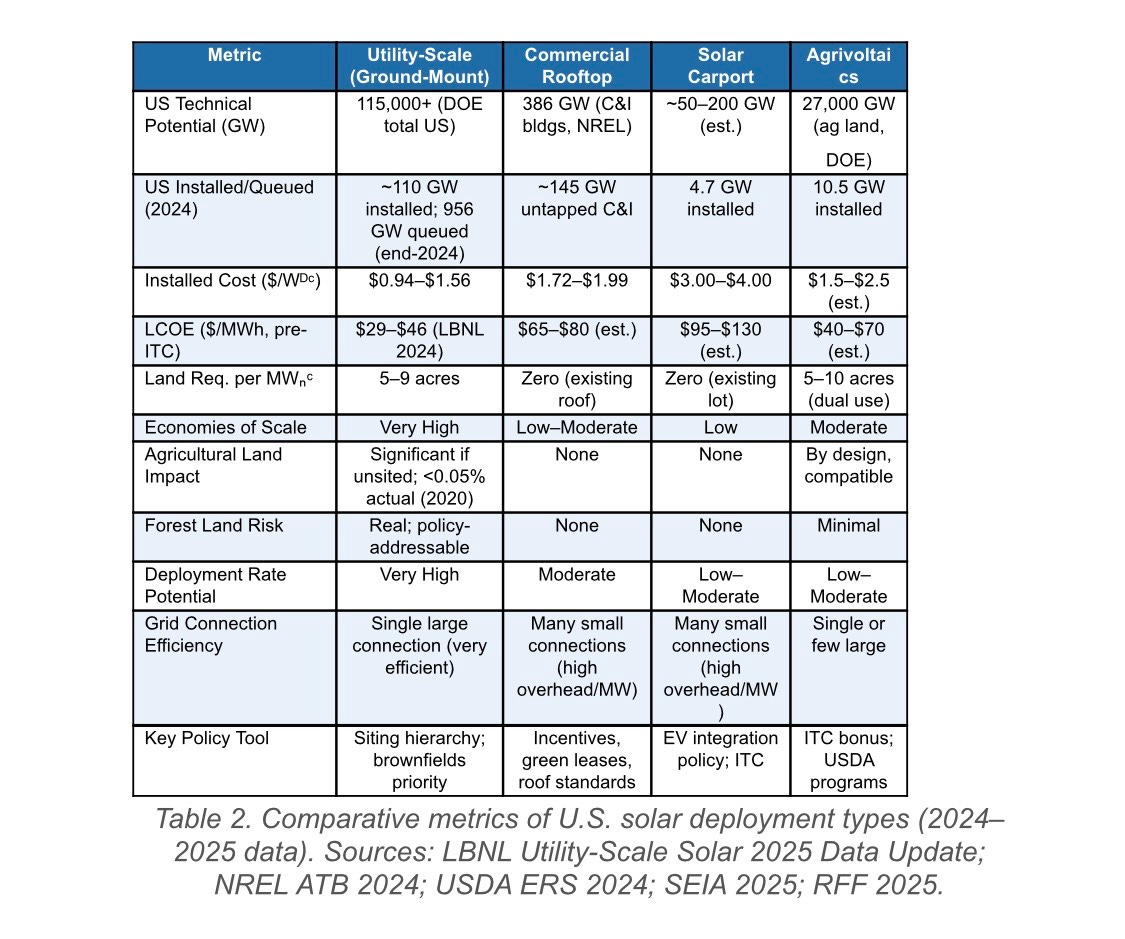
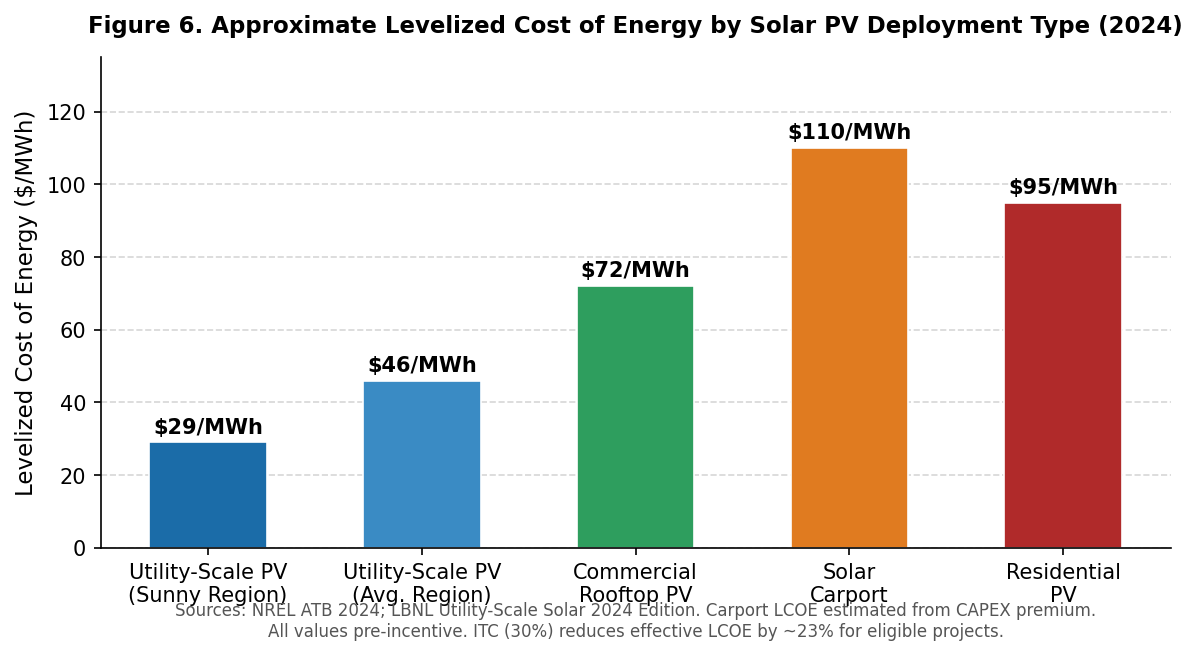
Figure 6. Approximate levelized cost of energy by solar deployment type (2024, pre-incentive). The utility-scale cost advantage is structural and enduring, not merely a function of current technology.
7.1 The Economy-of-Scale Argument in Detail
The cost differential between utility-scale and built-environment solar is not primarily about module prices, which have largely converged across system types. It is about everything else: structural engineering, interconnection overhead, permitting transactions, O&M logistics, and the fundamental economics of concentrated versus distributed installation. A single 200 MW utility-scale installation concentrates 400,000 to 800,000 modules on one site, with one land lease, one interconnection study, one EPC contractor, and one O&M contract. An equivalent 200 MW of commercial rooftop or carport solar would require hundreds of individual installations, each with its own structural assessment, permitting process, utility application, inverter commissioning, and maintenance arrangement.
NREL’s benchmark data confirm this empircially. At $1.78/Wᴰᶜ for commercial rooftop versus $1.08/Wᴰᶜ for utility-scale single-axis tracking (LBNL, 2024), the differential is 65 percent — even before accounting for the capacity factor penalty from suboptimal rooftop orientation. Solar carports, at $3.17/W, carry a 195 percent premium. Over a 25-year project life, these cost differences are enormous: a 200 MW rooftop portfolio financed at the same cost of capital as an equivalent utility-scale project would produce electricity at roughly 50 to 75 percent higher cost, all else equal. This is not an argument against building rooftop or carport solar; it is an argument against the claim that they can economically substitute for utility-scale at scale.
7.2 Complementarity, Not Competition
The appropriate analytical frame is not utility-scale versus built-environment, but utility-scale plus built-environment, with each filling the role its economics and siting context suit it for. Commercial rooftop and carport solar are intrinsically valuable: they reduce transmission losses, provide on-site resilience, avoid new land disturbance, are often co-located with demand, and may have superior value in certain grid contexts (peak shaving, demand charge reduction, EV charging integration). But they cannot, at any plausible deployment rate, replace the utility-scale pipeline needed to reach 45 percent solar by 2050. The math simply does not work. Even if every suitable commercial and industrial rooftop in the United States were fully utilized tomorrow — an impossibility for structural, financial, and market reasons — the resulting 386 GW would still be less than 40 percent of what the DOE projects must be built.
8. Policy Implications
The analysis above supports several specific policy conclusions:
Establish a rigorous siting hierarchy: Federal and state policy should establish a clear hierarchy that prioritizes brownfields, degraded and marginal lands, and low-ecological-value sites for utility-scale solar, with strong incentives (e.g., Inflation Reduction Act energy community bonuses) for brownfield and low-income community siting. Prime farmland and ecologically significant forest should be protected by targeted regulations, not blanket restrictions on utility-scale solar.
Strengthen agrivoltaics support: The DOE, USDA, and NREL InSPIRE program are already building the evidence base for agrivoltaics. ITC bonus credits for demonstrably compatible agrivoltaic configurations should be expanded, and USDA Farm Service Agency loan programs should be made explicitly compatible with agrivoltaics leases.
Address the commercial rooftop split-incentive problem at scale: Federal legislation enabling commercial property assessed clean energy (C-PACE) financing in all 50 states, combined with model green lease language developed by DOE and real estate industry partners, would materially accelerate commercial rooftop deployment without displacing utility-scale investment.
Require forest-conversion assessment: States with significant forest-to-solar conversion rates should require ecological impact assessments for any solar project proposing to clear more than a defined threshold of forested land, with robust mitigation requirements for high-value forest habitat.
Incentivize parking canopy solar at major traffic generators: Airports, shopping centers, sports facilities, and large employer campuses are natural candidates for solar canopy mandates or incentives, particularly when paired with EV charging infrastructure under the National Electric Vehicle Infrastructure (NEVI) program.
Invest in grid infrastructure to reduce pressure on prime land: A significant fraction of prime farmland and forest land near solar development occurs because that land happens to be near transmission infrastructure. Investment in new transmission reduces the locational premium on already-disturbed land near existing lines, expanding the viable pool of lower-conflict sites.
9. Conclusions
The narrative that solar development on agricultural and forested land is a large-scale, unnecessary problem that could be avoided by redirecting deployment to rooftops and parking lots is appealing, emotionally resonant, and substantially wrong as a policy prescription, even if it contains a legitimate kernel of concern. The evidence shows that solar’s actual agricultural land footprint is currently tiny — less than 0.05 percent of U.S. farmland — and that carefully targeted policy instruments can protect prime farmland and ecologically significant forest without abandoning the utility-scale pathway that economics, scale, and the pace of decarbonization require.
The economics of the built-environment pathway are real but limited. Commercial rooftop solar and solar carports are 65 to 195 percent more expensive per watt than utility-scale installations, reflecting genuine structural and logistical constraints that will not disappear with incremental technology improvement. Both categories represent important and underutilized resources that should be actively developed. But they are complements to utility-scale solar, not substitutes for it.
The United States needs more than 800 GW of additional solar capacity to approach mid-century decarbonization targets — calculated against the roughly 170 GW of total solar capacity (utility-scale plus distributed) installed at end-2024 versus the DOE’s implied 1,000-plus GW AC target range for 2050. Built-environment solar, at its most aggressive plausible deployment, can contribute perhaps 200 to 400 GW of that total. The remainder must come from the ground. The policy challenge is not to choose between these pathways but to pursue all of them intelligently — prioritizing sites that minimize ecological and agricultural disruption, accelerating commercial and industrial deployment through targeted financial instruments, and building the transmission infrastructure that expands the universe of viable low-conflict ground-mount sites. The sun shines on all of it.
Bibliography
U.S. Energy Information Administration (EIA). (2024). Electric sales, revenue, and average price: Table 4 — 2024 total electric industry average retail price (cents/kWh). https://www.eia.gov/electricity/sales_revenue_price/pdf/table_4.pdf
Earth Finance. (2022). Commercial rooftops: One of our most underutilized solar resources. https://www.earthfinance.com/insights/commercial-and-industrial-rooftops-one-of-americas-most-underutilized-solar-energy-resources
EnergySage. (2025). Solar marketplace intel report. https://www.energysage.com/marketplace-intel/
Gagnon, P., Margolis, R., Melius, J., Phillips, C., & Elmore, R. (2016). Rooftop solar photovoltaic technical potential in the United States: A detailed assessment. National Renewable Energy Laboratory. NREL/TP-6A20-65298. https://doi.org/10.2172/1236153
Great Plains Institute. (2023). The true land footprint of solar energy. https://betterenergy.org/blog/the-true-land-footprint-of-solar-energy/
Industry Research. (2026). Solar carports and canopies market trends. https://www.industryresearch.biz/market-reports/solar-carports-and-canopies-market-111788
Kleinman Energy Policy Research Center, University of Pennsylvania. (2024). Regulating utility-scale solar projects on agricultural land. https://kleinmanenergy.upenn.edu/research/publications/regulating-utility-scale-solar-projects-on-agricultural-land/
Kleinman Energy Policy Research Center, University of Pennsylvania. (2025). The use and potential of agrivoltaics in the United States. https://kleinmanenergy.upenn.edu/research/publications/the-use-and-potential-of-agrivoltaics-in-the-united-states/
Lawrence Berkeley National Laboratory (LBNL). (2022). Land requirements for utility-scale PV: An empirical update. https://emp.lbl.gov/sites/default/files/emp-files/land_requirements_for_utility-scale_pv.pdf
Lawrence Berkeley National Laboratory (LBNL). (2024). Utility-scale solar, 2024 edition: Empirical trends in deployment, technology, cost, performance, PPA pricing, and value in the United States. https://emp.lbl.gov/publications/utility-scale-solar-2024-edition Seel, J., Mulvaney Kemp, J., Cheyette, A., Gorman, W., Darghouth, N., Robson, D., Rand, J., & Jeong, S. (2025). U.S. utility-scale solar, 2025 data update: Analysis of empirical plant-level data from U.S. ground-mounted PV, PV+battery, and CSP plants. Lawrence Berkeley National Laboratory. https://emp.lbl.gov/utility-scale-solar
Lockheed Martin Corporation / U.S. DOE Better Buildings Initiative. (2024). Transforming a parking lot into an energy-generating solar carport. https://betterbuildingssolutioncenter.energy.gov/showcase-projects/lockheed-martin-transforming-parking-lot-energy-generating-solar-carport
National Renewable Energy Laboratory (NREL). (2024). Annual technology baseline 2024: Utility-scale PV, commercial PV, residential PV. https://atb.nrel.gov/electricity/2024/
National Renewable Energy Laboratory (NREL). (2024). Fall 2024 solar industry update. NREL/PR-7A40-92257. https://docs.nrel.gov/docs/fy25osti/92257.pdf National Renewable Energy Laboratory (NREL). (2025). Spring 2025 solar industry update. NREL/PR-7A40-95135. https://docs.nrel.gov/docs/fy25osti/95135.pdf
Ong, S., Campbell, C., Denholm, P., Margolis, R., & Heath, G. (2013). Land-use requirements for solar power plants in the United States. NREL/TP-6A20-56290. National Renewable Energy Laboratory. https://docs.nrel.gov/docs/fy13osti/56290.pdf
Resources for the Future (RFF). (2025). Converting forests to solar facilities: Causes, potential, and implications. https://www.rff.org/publications/reports/converting-forests-to-solar-facilities-causes-potential-and-implications/
Sol-Ark. (2025). The $630M commercial solar rooftop initiative. https://sol-ark.com/news/630-million-transform-commercial-rooftops/
Rand, J., Manderlink, N., Zhang, S., Talley, C., Gorman, W., Wiser, R. H., Seel, J., Mulvaney Kemp, J., Jeong, S., & Kahrl, F. (2025). Queued Up: 2025 Edition, characteristics of power plants seeking transmission interconnection as of the end of 2024. Lawrence Berkeley National Laboratory. https://emp.lbl.gov/publications/queued-2025-edition-characteristics Solar Energy Industries Association (SEIA). (2024). Land use & solar development. https://seia.org/initiatives/land-use-solar-development/
Solar Energy Industries Association (SEIA). (2024). Solar market insight report Q3 2024. Solar Energy Industries Association (SEIA). (2025). Solar market insight report 2024 year in review. https://seia.org/research-resources/solar-market-insight-report-2024-year-in-review/
U.S. Department of Agriculture, Economic Research Service (USDA ERS). (2024). Agricultural land near solar and wind projects usually remained in agriculture after development. Amber Waves. https://www.ers.usda.gov/amber-waves/2024/september/agricultural-land-near-solar-and-wind-projects-usually-remained-in-agriculture-after-development
U.S. Department of Energy (DOE). (2021). Solar futures study. Office of Energy Efficiency and Renewable Energy. https://www.energy.gov/eere/solar/solar-futures-study
U.S. Department of Energy (DOE), Solar Energy Technologies Office. (n.d.). Solar rooftop potential. https://www.energy.gov/eere/solar/solar-rooftop-potential
U.S. Department of Energy (DOE), Solar Energy Technologies Office. (n.d.). Farmer’s guide to going solar. https://www.energy.gov/eere/solar/farmers-guide-going-solar
U.S. Department of Energy (DOE). (2024). Solar photovoltaic system cost benchmarks. https://www.energy.gov/eere/solar/solar-photovoltaic-system-cost-benchmarks U.S. Energy Information Administration (EIA). (2025). Electric Power Monthly (February 2025 edition). https://www.eia.gov/electricity/monthly/ U.S. Energy Information Administration (EIA). (2025). Solar, battery storage to lead new U.S. generating capacity additions in 2025. https://www.eia.gov/todayinenergy/detail.php?id=64586 U.S. Energy Information Administration (EIA). (2026). New U.S. electric generating capacity expected to reach a record high in 2026. https://www.eia.gov/todayinenergy/detail.php?id=67205
Virginia Department of Energy & Virginia Tech Center for Geospatial Information Technology. (2024). Re-evaluating the land use impacts of utility-scale solar energy development in Virginia. https://energy.virginia.gov/renewable-energy/documents/Re-Evaluating%20Land%20Use%20Impacts%20of%20Utility-Scale%20Solar%20-%20FINAL.pdf
Author Note
Tom Johnson spent 38 years in power systems and energy research at Southern Company, ultimately leading its Renewable Energy Research Group. He is a graduate of Auburn University with a Bachelor of Chemical Engineering. The analysis and conclusions expressed in this document are those of the author.

—30—